
 Tanish Patel
Essential Reliability Strategies for Growing Fuel Delivery Platforms
The on-demand fuel delivery market is poised to reach $652.5 million by 2028, expanding at a 15% annual rate. In this high-stakes landscape, operational reliability is the primary differentiator that transforms a logistical service into a stable business. For app founders, growth is not just about expanding the fleet but about ensuring that every transaction remains seamless as volume increases.
Reliability serves as the foundation for customer trust and market retention. While competitors might prioritize rapid expansion, platforms that leverage infrastructure monitoring tools ensure consistent availability across diverse geographic regions. This precision allows founders to manage last-yard delivery challenges without sacrificing service quality.
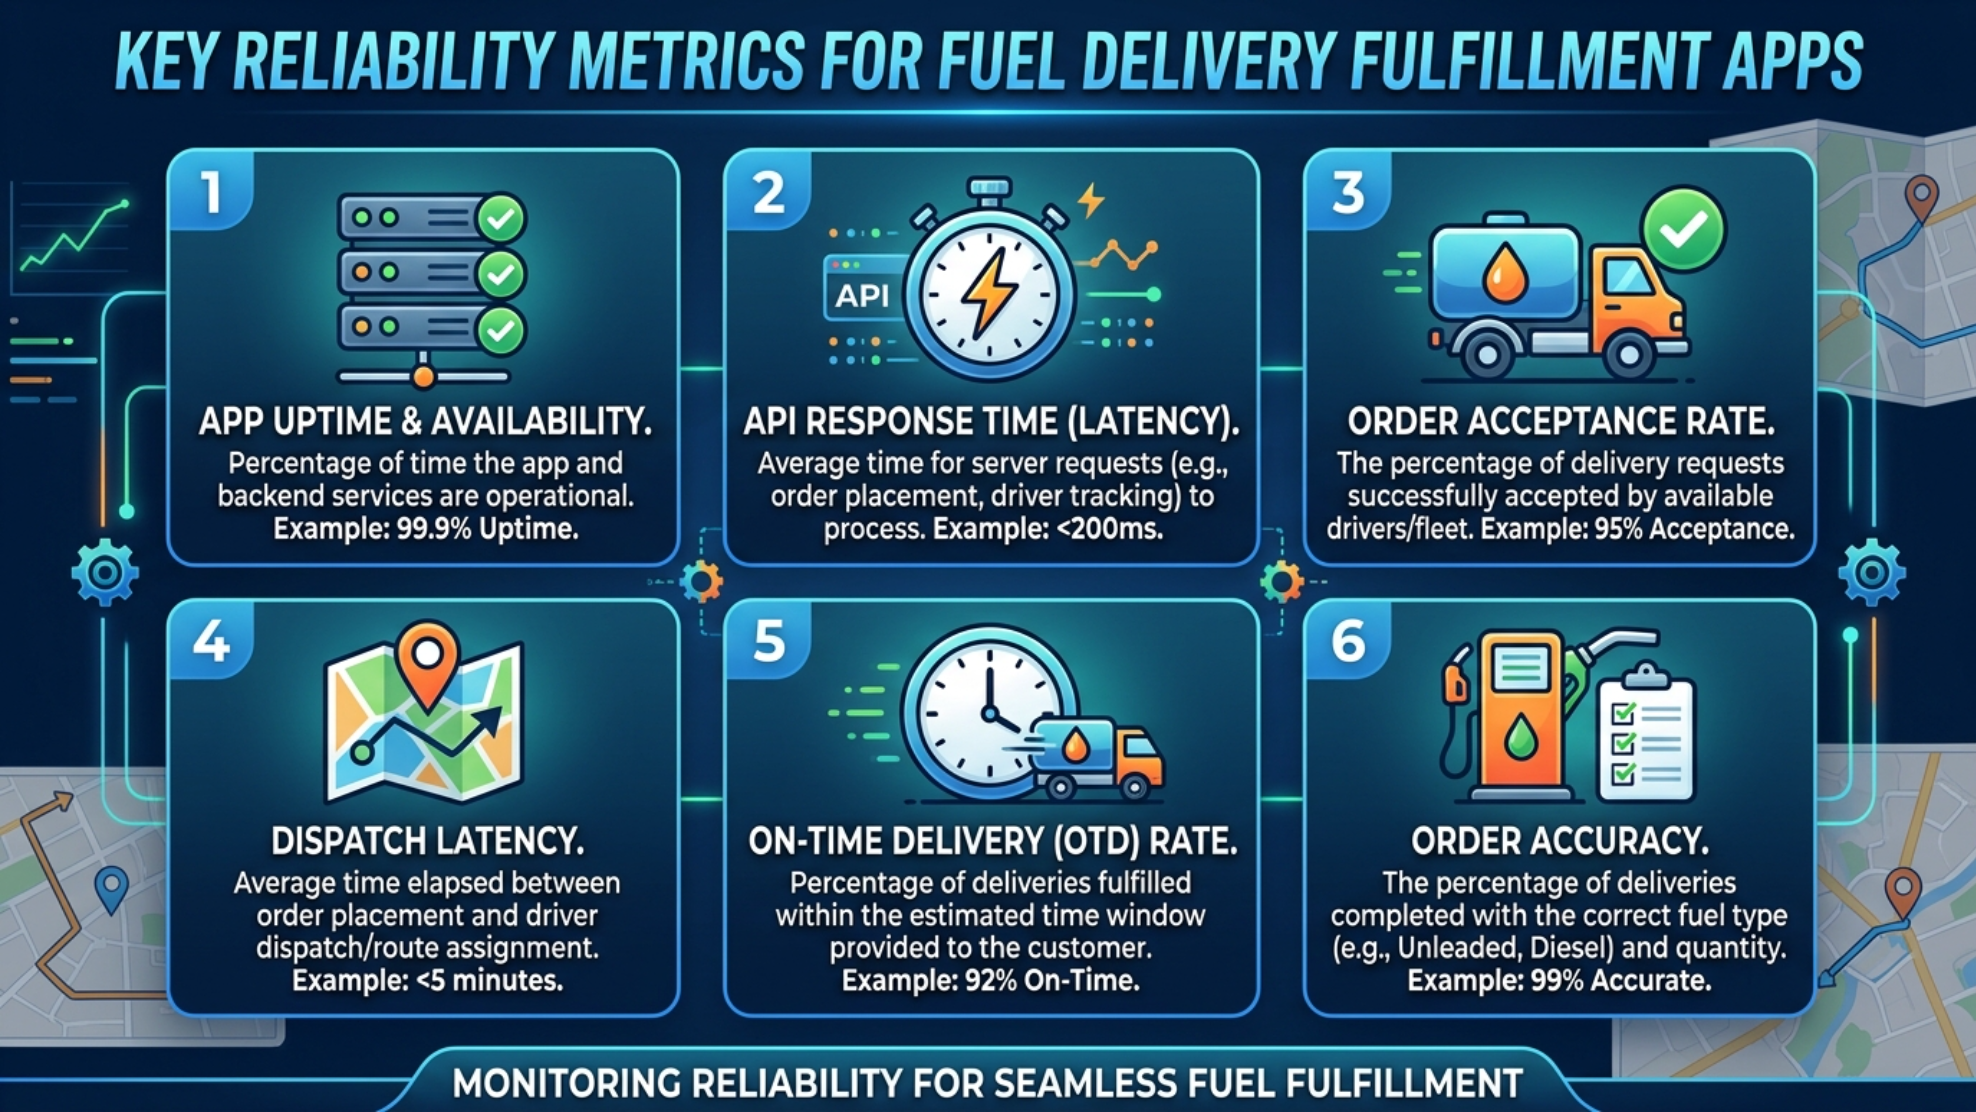
To secure market share, founders must implement high-precision key performance indicators that measure more than just uptime. Establishing metrics like accurate order cycle time and 99% order accuracy rate are essential steps in reducing operational overhead. Platforms that prioritize these data-driven insights avoid the common pitfalls of scaling too quickly, as reliability proves to be the most effective way to satisfy demanding end users.
Defining Essential Logistics and Fulfillment KPIs
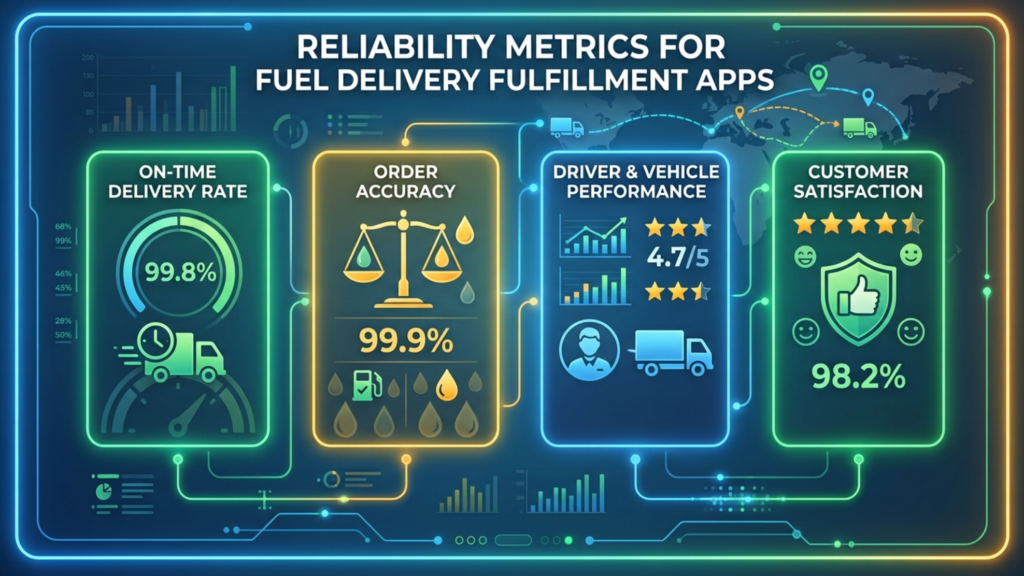
For founders building logistics platforms, shifting from reactive management to data-driven operations requires a focus on indicators that directly correlate with customer retention. Reliable delivery is not just an operational goal but a primary driver of service longevity. When platforms fail to hit promised delivery windows, they face significant financial penalties and customer churn, making On-Time Delivery the most critical metric to monitor.
What are the essential KPIs for logistics and delivery fulfillment platforms?
To effectively gauge the health of a logistics platform, prioritize On-Time Final Delivery, which measures a carrier’s ability to meet scheduled appointments and helps avoid costly retail chargebacks. For warehousing efficiency, track Inventory Accuracy to ensure the correct products are picked and shipped, alongside Yard-to-Stock metrics, which monitor the speed from receiving an inbound container to making it available for sale. Cost-per-pound analysis is also essential for uncovering buying trends and optimizing transportation spend. By focusing on these core indicators, founders and operations managers can identify bottlenecks and implement the process improvements necessary to scale reliably.
Operational excellence relies on maintaining a focus on a concise set of metrics. While it is tempting to track every data point available, industry experts suggest keeping a dashboard of 10 to 20 focused KPIs to prevent data overload. For warehousing, the Dock-to-Stock cycle time provides a granular view of how fast your physical facility turns received goods into sellable inventory. Efficient platforms prioritize these throughput metrics to maintain agility.
| KPI Category | Metric | Operational Impact |
|---|---|---|
| Reliability | On-Time Delivery | Preserves trust and reduces chargebacks. |
| Inventory | Accuracy Rate | Prevents stockouts and avoids costly mismatches. |
| Cost | Cost per Order | Identifies leaks in labor and shipping spend. |
When comparing against industry standards, remember that top operations consistently achieve a 99% order accuracy rate. If your platform is lagging due to high return volumes or picking errors, auditing these core fulfillment metrics is the first step toward correcting the discrepancy. Standardizing your financial definitions and tracking these indicators consistently across your team ensures that your scaling strategy remains grounded in actual performance rather than projections.
Standardizing Reliability Metrics for Rapid On-Demand Scaling
For on-demand delivery apps, industry-standard reliability is measured through a combination of DORA metrics and user-centric performance indicators. You should prioritize DORA’s instability metrics, specifically Change Failure Rate and Failed Deployment Recovery Time, to ensure rapid, stable releases. Complement these with SRE-driven metrics such as system uptime, latency, and error rates to monitor the application’s real-world health.
Establishing Service Level Objectives (SLOs) allows you to define these thresholds based on user expectations rather than just technical performance. When selecting infrastructure monitoring tools, engineering teams should look for platforms that unify these metrics into a single view. Tracking these data points together provides a complete picture of your app’s dependability, helping you balance fast releases with a seamless experience for your end users.
Change Failure Rate. This indicates the percentage of changes to the production environment that result in degraded service. Low rates suggest that automated testing and staging pipelines are effectively catching integration issues before they impact live delivery requests.
Mean Time to Repair. Often tracked as part of recovery metrics, this measures the speed of restoring functionality after an outage. In on-demand platforms, minimizing this duration is critical to maintaining consumer trust and preventing failed delivery experiences during peak windows.
Service Level Objectives. These are actionable reliability targets that align engineering goals with business outcomes. Effective SLOs focus on availability metrics that directly impact user satisfaction, such as the success rate of payment processing or the responsiveness of real-time location mapping.
Understanding Uptime Monitoring for Delivery Platforms
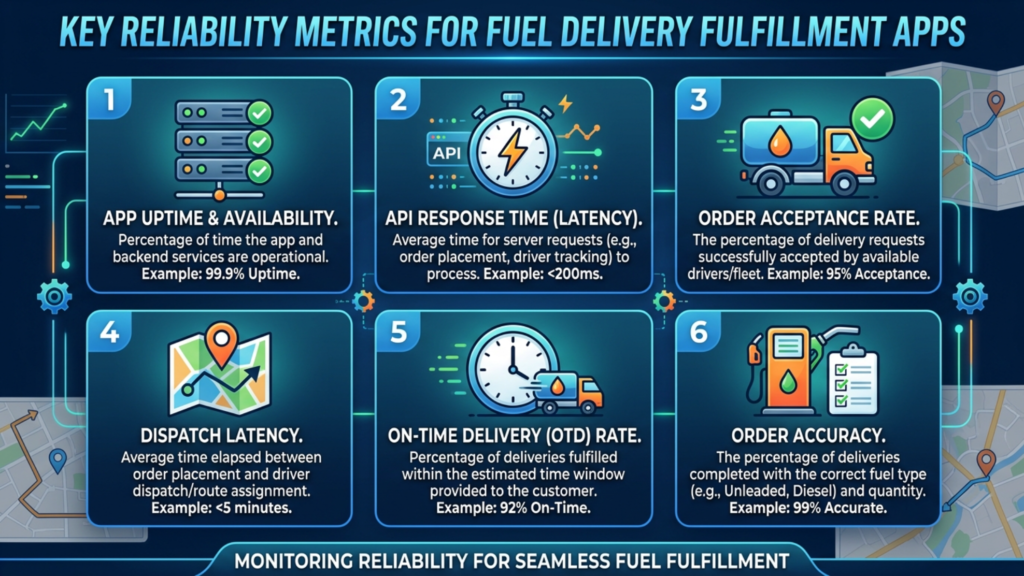
An uptime monitoring system acts as an essential diagnostic layer that continuously tracks the reachability and responsiveness of your digital services. For delivery applications, this reliability is critical because any interruption directly halts real-time logistics, preventing customers from confirming their orders or monitoring active shipments. When you rely on such high-stakes infrastructure, these monitoring tools prevent small technical glitches from escalating into significant operational outages.
Why uptime monitoring is critical for logistics startups
Reliability serves as the core pillar for maintaining long-term user retention in a crowded market. Unlike static sites, delivery platforms require synchronous communication between mobile user interfaces, driver applications, and backend inventory systems. By deploying proactive alerting, your engineering team can identify and resolve technical bottlenecks before they impact the end user. This real-time visibility transforms your platform from a reactive service into a stable environment capable of managing peak demand cycles without failure.
- Synthetic monitoring allows for the simulation of complex user paths, such as order checkouts and status updates, to ensure operational integrity.
- Infrastructure monitoring tools track the health of cloud and edge components to prevent resource exhaustion during high-traffic periods.
- Digital experience monitoring provides a user-centric view of performance, ensuring that geographic bottlenecks do not disrupt local delivery coordination.
Consistency also directly influences user retention for logistics platforms. Research shows that app responsiveness and the speed of feedback to user queries are defining operational metrics for user satisfaction. By keeping services functional and transparent through status pages during incidents, companies can mitigate the negative impact of unavoidable system issues. Implementing modern infrastructure monitoring tools alongside automated alerts ensures that downtime remains the exception rather than the standard, ultimately securing the reliability that your customers expect from a professional service.
Selecting Infrastructure and Observability Tooling
Selecting the right diagnostic stack requires moving beyond simple ping-based tests. Modern platforms must track the health of cloud environments, databases, and network components to ensure seamless delivery operations. According to Best Infrastructure Monitoring Tools Reviews 2026, infrastructure monitoring platforms now provide essential visibility into resource utilization, container health, and API responsiveness across complex hybrid environments.
Comparing APM solutions versus lightweight monitoring
For early-stage startups, lightweight monitoring tools offer a fast, low-complexity path to tracking uptime. These services verify site reachability and basic content patterns, providing a high-level view of app availability. However, as logistics platforms scale, they often require Application Performance Monitoring (APM) solutions. APM tools go deep into the code, correlating metrics, logs, and traces to identify the root cause of latency or failures in order processing and payment gateways.
Which tools are recommended for monitoring uptime, error tracking, and performance in delivery software?
To maintain software reliability, you need a combination of observability and alerting tools to catch performance bottlenecks and downtime before they impact users. For dedicated uptime and endpoint monitoring, services like UptimeRobot prove effective for tracking status and response times across critical services. If you require deep visibility into infrastructure health, including containers and network performance, platforms such as Datadog provide industry-standard metrics and advanced diagnostic capabilities. For teams focused on server health and hardware resource utilization, tools like ManageEngine and Checkmk are highly rated for ongoing infrastructure tracking. Your choice should balance your team’s specific monitoring depth requirements with the complexity of your tech stack.
Ultimately, the effectiveness of your observability depends on actionable alerts. Whether you choose lightweight monitors or comprehensive APM suites, integration with incident management workflows ensures your engineering team is notified immediately when service levels drop. Standardizing these metrics allows your platform to shift from reactive firefighting to proactive, automated performance management.
Fuel-Specific Operational KPIs for Efficiency
Moving beyond general logistics metrics requires fuel delivery platforms to focus on granular data that reflects the unique constraints of hazardous material transport. While standard fulfillment KPIs cover basic delivery speed, fuel distributors must align their software monitoring toward specific operational throughput indicators to stay competitive.
Planned vs. Actual Route Time. This foundational KPI measures the difference between scheduled and realized delivery times. By comparing these values, startups can identify if drivers are deviating from routes or if dispatch planning is consistently underestimating travel times.
Gallons per Trip. This metric assesses stop planning efficiency and overall vehicle capacity utilization. Operators can evaluate whether topping off tanks during existing routes, when safety permits, makes sense for their specific fleet configuration.
Gallons per Hour. This efficiency indicator provides a more accurate view of productivity than cost-per-mile. It captures slack time, yard delays, and deviations from the plan, offering a fuller picture of how drivers and assets perform throughout a shift.
Using automated routing systems with mobile application integration is necessary to capture accurate start and stop times, which prevents the data drift often found in manual tracking. When platforms leverage these metrics, they gain the visibility needed to optimize fleet capacity and potentially reduce the number of drivers required for a given route volume.
Infrastructure monitoring tools are essential for visualizing these trends. By tracking performance from the user perspective and correlating these metrics with backend operational data, founders can decide whether to add new delivery zones or merge existing ones by analyzing trip density per zip code.
Market Insights and Consumer Adoption Trends
The rapid expansion of the digital delivery sector reflects a fundamental shift in how consumers interact with essential services. Current usage data indicates that over 28% of Americans rely on food delivery services at least once per week, while another 44% utilize these platforms on a less frequent basis. This significant level of integration is largely propelled by the growth of the overall digital delivery market, which one industry report estimates will reach a $505.5 billion valuation by 2030.
What percentage of the population uses food delivery applications?
Despite widespread adoption, roughly 24.5% of the population remains untapped. For founders building new platforms, this segment represents a substantial opportunity to capture market share. Research highlights that modern consumers categorize a diverse range of payment options as the most essential feature for platform satisfaction, followed by effective promotional offers and transparent refund mechanisms. These convenience features serve as the primary drivers for long-term user retention.
While global platforms often leverage complex algorithms for order allocation, the user-facing interface remains the most critical factor for operational success. Users prioritize speed, navigation, and feedback. When developing your product, consider that app responsiveness is a core metric for maintaining trust. By focusing on these convenience-driven requirements, platforms can successfully convert hesitant users into loyal, recurring customers.
Implementing Advanced Reliability Testing
To protect complex delivery flows, you need more than basic uptime checks. Simple ping-based tests verify server reachability, but they often fail to capture front-end JavaScript errors or broken user flows. To address this, use infrastructure monitoring tools that offer automated tests simulating real user journeys like login sequences and checkout flows 24/7.
Simulating complex user behavior
Testing with a real browser is essential for validating key user actions like purchases or sign-ups. By automating interactions within a live browser environment, these tests can confirm that buttons are clickable, tax calculations trigger correctly, and confirmation screens load within acceptable time windows. This level of verification prevents the costly scenario where a service appears ‘up’ to ping tests but remains functionally broken for the end user.
Integrating reliability into the development lifecycle
Testing earlier in your development process bridges the gap between development and production stability. By integrating automated performance and functional tests into the build process, teams identify and resolve reliability regressions before they deploy to live systems. This proactive strategy focuses on measuring functional availability rather than just connectivity, ensuring that the entire application stack remains resilient during high-demand periods.
Scaling Through Data-Driven Reliability
For app founders managing logistics and fuel delivery, reaching operational scale requires moving beyond reactive patches to a proactive reliability model. Reliable delivery platforms rely on infrastructure monitoring tools that do more than track basic status, as modern users demand seamless, multi-step transaction flows. Prioritizing visibility across your API layers and user journeys is a competitive necessity rather than an optional overhead.
- Audit your current diagnostic coverage to ensure you can simulate end-to-end user paths, such as order placement and payment processing.
- Consolidate your alerting strategy to distinguish between critical infrastructure failures and non-urgent service warnings, reducing team fatigue.
- Standardize your performance tracking by integrating real-time telemetry where your team can correlate metrics with actual user friction points.
- Establish clear service-level objectives to align your development cycles with delivery promises, ensuring that operational uptime remains a core metric for feature releases.
Balancing rapid innovation with platform stability is the defining challenge for growing startups. By anchoring your product growth in measurable availability and performance benchmarks, you build the trust required to retain sophisticated users. A mature approach to observability turns your reliability stack into a foundation for predictable, sustainable expansion.



 Jennifer watson
 United States
 United Kingdom
 India
India Canada
 Singapore


![10 Benefits of the Internet of Things You Should Know [2025]](https://www.appstory.org/wp-content/uploads/2025/03/ATS-10-Benefits-of-the-Internet-of-Things-You-Should-Know-2025@2x-80x60.png)


